❄️ The world of fractals


A playground of recursive wonders
Section titled “A playground of recursive wonders”🐢 L-systems & turtle graphics
🐢 Fractals & turtle graphics
🕹️ Chaos game fractals
🧽 Menger sponge
🐫 Sierpiński pyramid
🍞 Mandelbrot & Julia sets
🔗 Related to plant structures page
🐢 L-systems & turtle graphics
Section titled “🐢 L-systems & turtle graphics”
📖 Fractal structures and aperiodic tilings generated with L-systems and turtle graphics
©️ Formulas for fractals taken from library.fridoverweij.com
👉 Learn more about L-systems
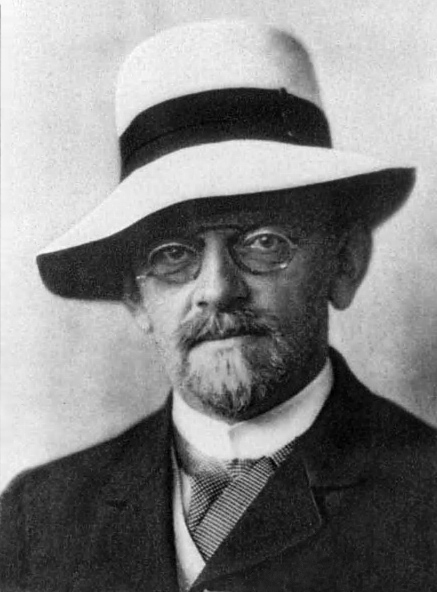
In 1891, David Hilbert described a remarkable mathematical object: a continuous curve that fills an entire square.
At its -th finite approximation, the length of the curve is given by:
As , its length diverges, yet every point remains inside a square of area one. In the limit, the curve passes through every point of that square!
Formulated more accurately: the Hausdorff dimension of the Hilbert curve equals exactly 2.
🐢 Fractals & turtle graphics
Section titled “🐢 Fractals & turtle graphics”
📖 Famous fractal structures generated with turtle graphics
🎯 Learn how to draw fractals using turtle graphics
🧠 Inspired by github.com/jeffvun/fractals
🐍 A VPython version is available as well, see fractals.py
🕹️ Chaos game fractals
Section titled “🕹️ Chaos game fractals”
🎯 Improved understanding of the chaos game
🧠 Inspired by nnakul/chaos-game by Nikhil Nakul
🐍 A VPython version is available as well, see chaos_game.py
About the chaos game
Section titled “About the chaos game”
Source Wikipedia
The chaos game is an iterative procedure that can be written as an affine transformation
where the set of pairs with matrices and characterize the chosen ruleset and denotes a (per iteration) randomly chosen index. The famous Barnsley fern is generated in a similar way.
Why do fractals arise from the chaos game
Section titled “Why do fractals arise from the chaos game”The chaos game is an iterative process of placing dots on a canvas using certain fixed locations (vertices) that are chosen randomly.
For example, in the animation on the right, the position of each new dot is halfway between the current position and one of the three fixed corners of a triangle.
Let’s assume we start with a point that is located in one of the areas that will eventually be empty, see the figure on the right.
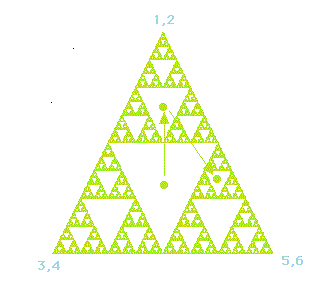
Source BU Math
After one iteration, the point will jump to either one of the three smaller empty triangles. Eventually after a couple of iterations, the point will enter a small triangle that is so small that, given the finite resolution of the screen and the pixels it contains, it will disappear.
In a certain sense, the fractal itself is a kind of strange attractor!
🧽 Menger sponge
Section titled “🧽 Menger sponge”
📖 Interactive 3D rendition of the Menger sponge
💡 Karl Menger (1902–1985) introduced the sponge during his research on topologic dimensions.
🐍 A VPython demo is available as well, see menger_sponge.py
🐫 Sierpiński pyramid
Section titled “🐫 Sierpiński pyramid”
📖 Interactive 3D rendition of the Sierpiński pyramid
🧠 Inspired by a student assignment by S. Seth Long
💡 Wacław Sierpiński (1882–1969) introduced his famous triangle and carpet constructions around 1915.
🐍 A VPython demo is available as well, see sierpinski.py
🍞 Mandelbrot & Julia sets
Section titled “🍞 Mandelbrot & Julia sets”
📖 Interactive visualization of the Mandelbrot, Julia, and burning ship fractals
💡 Benoit Mandelbrot (1924–2010) was the first to coin the term fractal and first published his ideas in the book: Fractals: Form, Chance and Dimension
🐍 Mandelbrot VPython and Julia VPython versions are available as well
Julia and Mandelbrot sets explained
Section titled “Julia and Mandelbrot sets explained”The term fractal was coined by Benoît Mandelbrot himself, and is derived from the Latin word ‘fractus’, which means broken or fractured.
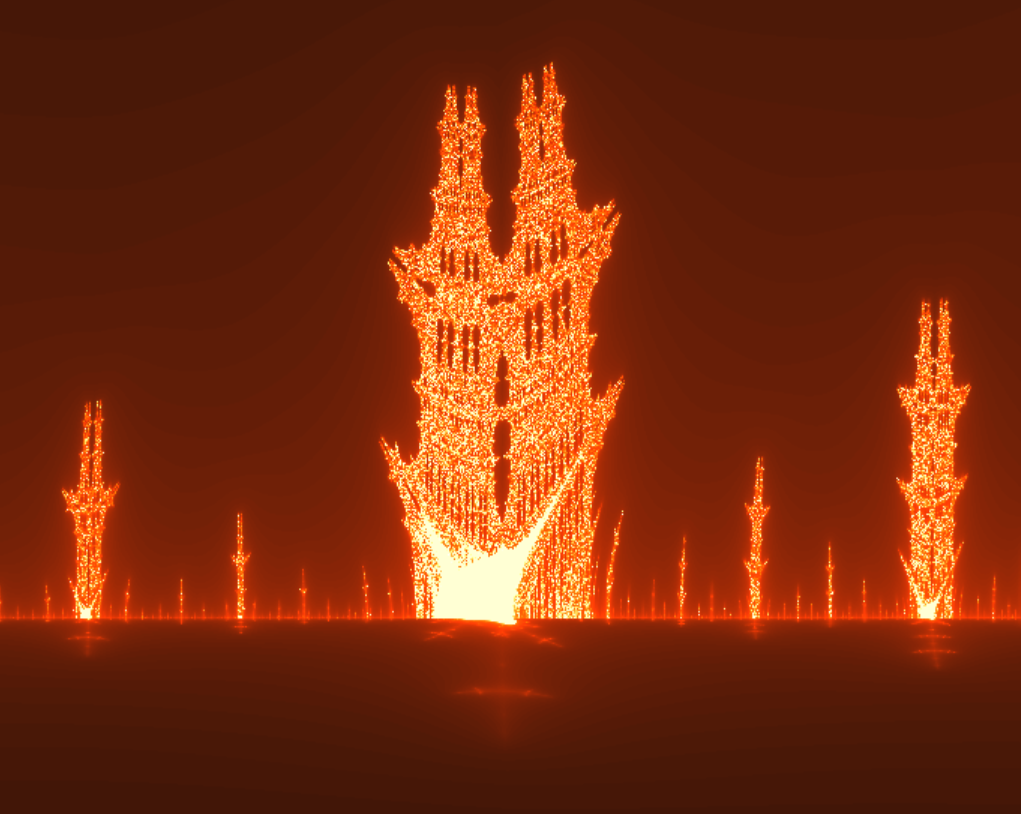
The Mandelbrot and Julia sets are examples of such fractals. Such a set (fractal) can be drawn on a piece of paper, or on a computer screen, i.e. a plane. Each point in this plane actually represents a (two-dimensional) value/number, called a complex number.
The collection of points, or numbers that lie “inside” the fractal (black part), is the actual Mandelbrot set. The remaining points are said to be “outside” the Mandelbrot set.
Whether a point is on the inside or outside, is associated with a mathematical concept called convergence (and divergence). For example, if you multiply a number by itself again and again, it runs away to infinity if your starting value is greater than one, i.e. it diverges, and it approaches zero if your starting value is less than one, i.e. it converges. And, of course, if you start with 1, it always remains one.
So summarizing, the Mandelbrot set depicts which set of (two-dimensional) numbers converges when multiplied by itself (the Mandelbrot set, or the inside), and which set of numbers diverges when multiplied by itself (the outside).
A more thorough visual explanation is given in the video The Mandelbrot Set Explained.
Julia sets
Section titled “Julia sets”As was explained above, the Mandelbrot set is generated by multiplying a two-dimension (i.e. complex) number by itself, or stated differently, by (iteratively) squaring this number.
This can more rigorously be expressed by the formula:
where the index labels each consecutive iteration.
The Mandelbrot set is generated using (start value), and let vary across the (complex) plane, and check for each value of whether the iteration process diverges or not.
Julia sets are generated by varying across the (complex) plane, while the parameter is kept constant instead. This implies that for each value of , a different Julia set will be generated!
This difference is also neatly addressed in the video Julia Sets, and how they relate to The Mandelbrot Set, which is a follow-up on The Mandelbrot Set Explained.
The burning ship fractal
Section titled “The burning ship fractal”As was explained above, the Mandelbrot set is generated by multiplying a (complex) number by itself, or stated more rigorously:
where the index labels each consecutive iteration. The start value is zero.
The burning ship uses a somewhat modified version of this formula, namely:
In addition, a different (and fixed) color mapping is used that underscores the metaphor of a burning ship.
Mandelbrot set defined mathematically
Section titled “Mandelbrot set defined mathematically”A Mandelbrot set is defined as a two-dimensional set in the complex plane for which an infinite sequence of numbers , defined by the recursive relation
does not diverge to infinity. The parameter is also known as point of interest.
The complex numbers that do remain bounded make up the inner glowing regions of the Mandelbrot set. Particularly interesting behaviour shows up near the edges of the set. The visualizations are realized by color-coding exactly this rate of divergence.
The Mandelbrot set illustrates the same principle as Conway’s Game of Life, namely that complex structures can emerge from an astonishingly small and simple set of rules.
There are certain regions of values for the parameter (point of interest), where a tiny change in the value of this parameter results in a completely different (convergence) behaviour of our function. Any system that responds completely differently to any such a tiny change in its parameter(s) is said to behave chaotically.
Chaos theory studies exactly these kind of systems. They are said to behave chaotically, as they turn out to behave unpredictably given there sensitivity on their initial/boundary condition(s).
Chaotic systems are quite well known because of the so-called butterfly-effect: a distant butterfly flapping its wings a few weeks ago, may be causing a tornado’s route to change its course, similar to a slight change in a parameter value (in this case of the constant ) that causes the function to either diverge to infinity or remain bounded.
The butterfly-effect is more rigorously is defined as a deterministic non-linear response of a system that for its future state(s) is (extremely) sensitive on one or more of its initial conditions.
Some history
Section titled “Some history”Robert W. Brooks & Peter Matelski first described and illustrated this set in 1978 as a part of a study on Kleinian groups. Two years later, Benoît Mandelbrot managed to create the first now well-known visualizations of the set, while working at IBM’s Thomas J. Watson Research Center in New York:
Because of his access to IBM’s computers, Mandelbrot was one of the first to use computer graphics to create and display fractal geometric images, leading to his discovery of the Mandelbrot set in 1980. He showed how visual complexity can be created from simple rules. He said that things typically considered to be “rough”, a “mess”, or “chaotic”, such as clouds or shorelines, actually had a “degree of order”. — Wikipedia