🌾 Scalar fields


3D scalar fields
Section titled “3D scalar fields”
🎯 An example of how to visualize scalar fields
🐍 A VPython version is also available as scalar_plot.py.
What am I looking at?
Section titled “What am I looking at?”A scalar field is simply a function such that that assigns a single numeric value to each point in space. Examples of scalar fields are:
- temperature in a room
- pressure in the atmosphere
- electric potential of a charge
In this demo, the scalar field represents temperature in 3D space.
🔥 Starting situation: a hot spot
Section titled “🔥 Starting situation: a hot spot”At the beginning, the temperature is highest near the center and decreases smoothly outward:
This describes a localized heat source:
- hottest at the center
- cooler further away
- symmetric in all directions
You can think of this as a small hot object placed in cold space.
What happens over time? (Heat diffusion)
Section titled “What happens over time? (Heat diffusion)”As time passes, heat spreads out due to diffusion.
Mathematically, this is described by the heat equation:
We don’t need to solve this equation to understand what happens:
- heat flows from hot regions to cold regions
- sharp peaks smooth out
- the temperature distribution becomes wider and flatter
In the animation, this means:
- colors fade at the center
- warmth spreads outward
- no heat is created or destroyed, it only redistributes
How to read the visualization
Section titled “How to read the visualization”- Position of a sphere → where in space we measure temperature
- Color of a sphere → temperature at that position
- Time → how long heat has been spreading
Why this is useful
Section titled “Why this is useful”This kind of visualization helps you:
- understand abstract functions in 3D
- see what a partial differential equation does, not just how it’s written
- connect mathematics to physical intuition
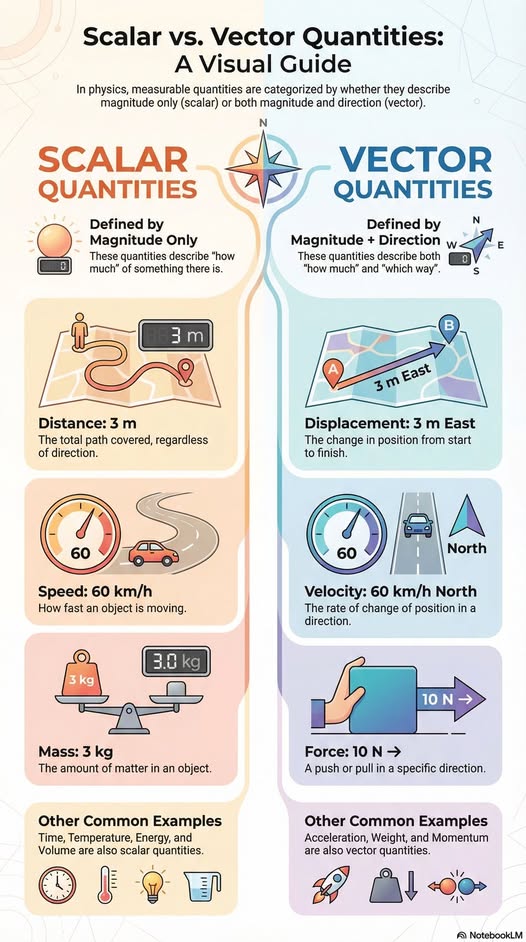
Scalar vis-à-vis vector quantities
Section titled “Scalar vis-à-vis vector quantities”