❄️ Fractals


Fractals & turtle graphics 🐢
Section titled “Fractals & turtle graphics 🐢”
🎯 Learn how to draw fractals using turtle graphics
🧠 Inspired by github.com/jeffvun/fractals
🐍 A VPython version is available as well, see fractals.py
L-systems & turtle graphics 🐢
Section titled “L-systems & turtle graphics 🐢”
©️ Formulas for fractals taken from library.fridoverweij.com
🔗 Related to plants demo
👉 Learn more about L-systems
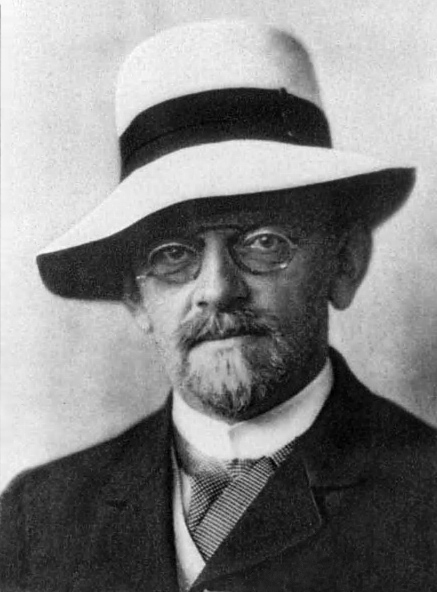
In 1891, David Hilbert described a remarkable mathematical object: a continuous curve that fills an entire square.
At its -th finite approximation, the length of the curve is given by:
As , its length diverges, yet every point remains inside a square of area one. In the limit, the curve passes through every point of that square!
Formulated more accurately: the Hausdorff dimension of the Hilbert curve equals exactly 2.