Interactive simulations & visualizations
Visualizing the beauty in physics and mathematics
Project maintained by zhendrikse Hosted on GitHub Pages — Theme by mattgraham
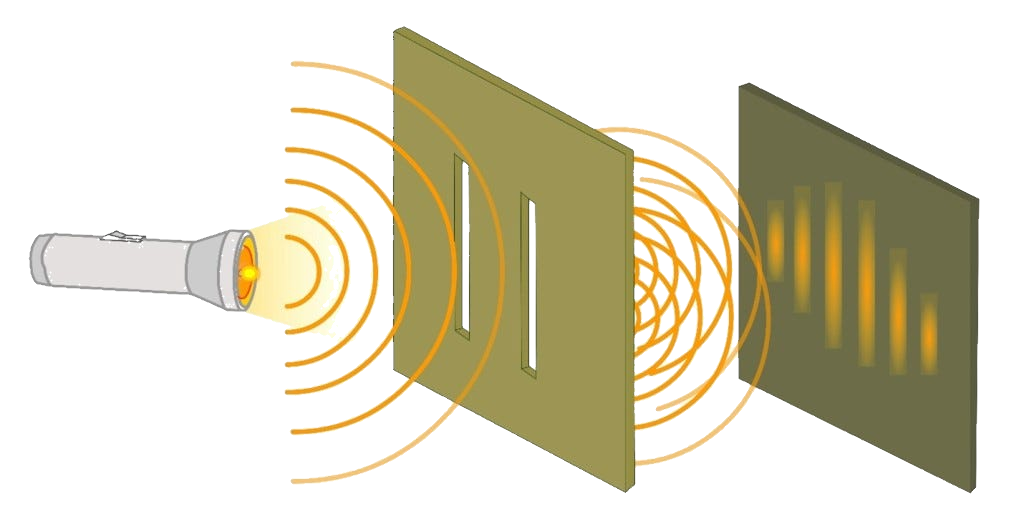
Double slit experiment
📌 Highly recommended background information: Simulating and visualizing the double slit experiment with Python
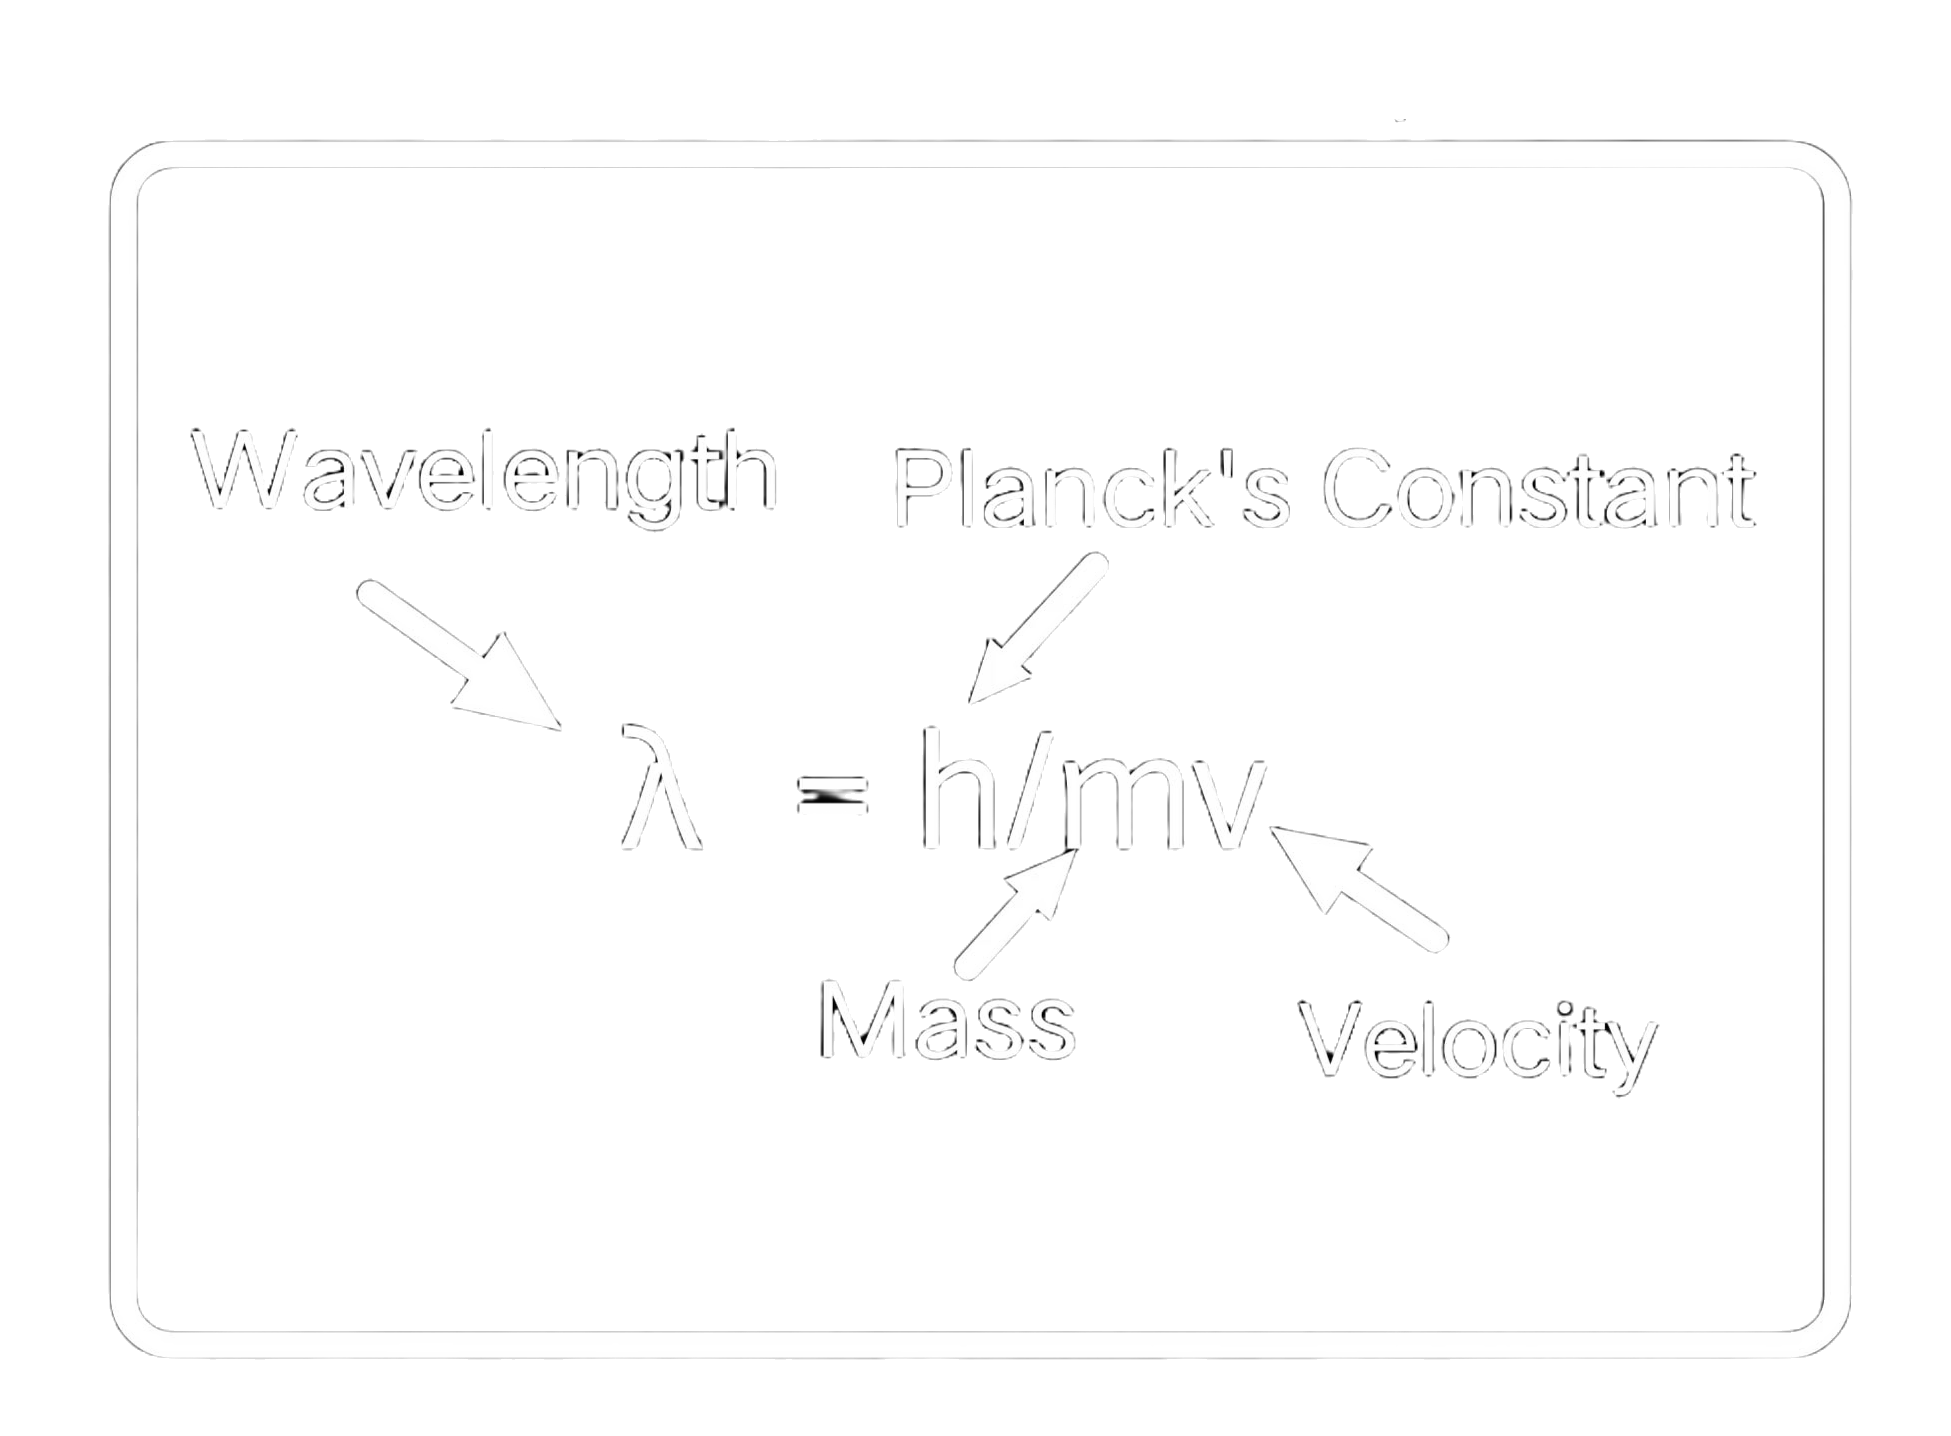
Wave-particle duality
In this visualization, the interference pattern is generated “statically”, i.e. by calculating the path difference between the beams originating from each source and setting the (pixel) color of the background accordingly.
The two slits are represented by the two cylinders that also now firing particles at the screen/detector in the simulation, so that the difference in the behavior of particles and waves can be clearly seen.
🔧 Original VPython version by Let's code physics
👉 See also his accompanying video
👉 VPython version available as double_slit.py
How the interference pattern is generated
The intensity is given by:
\[\begin{equation} I = \cos^2\left(\frac{\pi , \Delta r}{\lambda}\right) \end{equation}\]This is easily translated in code as follows:
this._position.set(x, y, 0);
const r1 = this._position.distanceTo(this._slit1);
const r2 = this._position.distanceTo(this._slit2);
const pathDiff = Math.abs(r1 - r2);
const rAverage = (r1 + r2) * 0.5;
const envelope = 1 / (1 + 0.1 * rAverage);

const brightness = Math.pow(Math.cos(Math.PI * pathDiff / this._wavelength), 2) * envelope;
Additional two-dimensional simulation
⭐ Based on QuantumScattering2D.html by Daniel V. Schroeder, Weber State University
🔑 Updated and refactored and by Zeger Hendrikse
⭐ More physics software by Daniel V. Schroeder can be found here
This program simulates scattering of a quantum particle from a stationary barrier in two dimensions. The particle’s initial state is a Gaussian wavepacket, whose average energy you can adjust. You can choose from seven different barrier shapes, and adjust their properties. Try a variety of settings to explore reflection, transmission, tunneling, and interference.
The brightness of the wavefunction image indicates the wavefunction’s magnitude, while the color hue indicates the phase, going from red (pure real and positive) to light green (pure imaginary and positive) to cyan (pure real and negative) to purple (pure imaginary and negative) and finally back to red. Use the slider to adjust the overall brightness.
The simulation uses natural units in which the particle’s mass, Planck’s constant $\hbar$, and the (nominal) screen pixel width are all equal to $1$. It works by integrating a discretized version of the time-dependent Schrödinger equation, with a grid spacing of one unit and a grid size of $400 \times 400$. The wavefunction is always zero along all edges of the square grid, so the particle is effectively trapped inside a $400 \times 400$ box. — Paraphrased from instructions at QuantumScattering2D.html
Background information
In 1801, Thomas Young was the first to perform an experiment that made it unequivocally clear that light is a wave, since the interference pattern he observed was exactly similar to an interference pattern that would have been produced by water waves.
Videos on the mystery of the double slit experiment
The following videos are recommended to learn more about the double slit experiment and its repercussions for our view on the reality of nature:
- Single Photon Interference by Veritassium, where the experiment is actually performed!
- The Quantum Experiment that Broke Reality by PBS Space Time, with a more in-depth explanation.
- Dr.Quantum — Double slit experiment, a video that is more accessible to the public.


Particle-wave duality
Share on: