Interactive simulations & visualizations
Visualizing the beauty in physics and mathematics
Project maintained by zhendrikse Hosted on GitHub Pages — Theme by mattgraham
Generating Mandelbrot images
👉 Click anywhere on the fractal to re-center
Julia and Mandelbrot sets explained
The term fractal was coined by Benoît Mandelbrot himself, and is derived from the Latin word ‘fractus’, which means broken or fractured.
The Mandelbrot and Julia sets are examples of such fractals. Such a set (fractal) can be drawn on a piece of paper, or on a computer screen, i.e. a plane. Each point in this plane actually represents a (two-dimensional) value/number, called a complex number.
The collection of points, or numbers that lie “inside” the fractal (black part), is the actual Mandelbrot set. The remaining points are said to be “outside” the Mandelbrot set.
Whether a point is on the inside or outside, is associated with a mathematical concept called convergence (and divergence). For example, if you multiply a number by itself again and again, it runs away to infinity if your starting value is greater than one, i.e. it diverges, and it approaches zero if your starting value is less than one, i.e. it converges. And, of course, if you start with 1, it always remains one.
So summarizing, the Mandelbrot set depicts which set of (two-dimensional) numbers converges when multiplied by itself (the Mandelbrot set, or the inside), and which set of numbers diverges when multiplied by itself (the outside).
A more thorough visual explanation is given in the video The Mandelbrot Set Explained.
Julia sets
As was explained above, the Mandelbrot set is generated by multiplying a two-dimension (i.e. complex) number by itself, or stated differently, by (iteratively) squaring this number.
This can more rigorously be expressed by the formula:
$z_{n+1} = z_n^2 + c$
where the index $n$ labels each consecutive iteration.
The Mandelbrot set is generated using $z_0=0$ (start value), and let $c$ vary across the (complex) plane, and check for each value of $c$ whether the iteration process diverges or not.
Julia sets are generated by varying $z$ across the (complex) plane, while the parameter $c$ is kept constant instead. This implies that for each value of $c$, a different Julia set will be generated!
This difference is also neatly addressed in the video Julia Sets, and how they relate to The Mandelbrot Set, which is a follow-up on The Mandelbrot Set Explained.
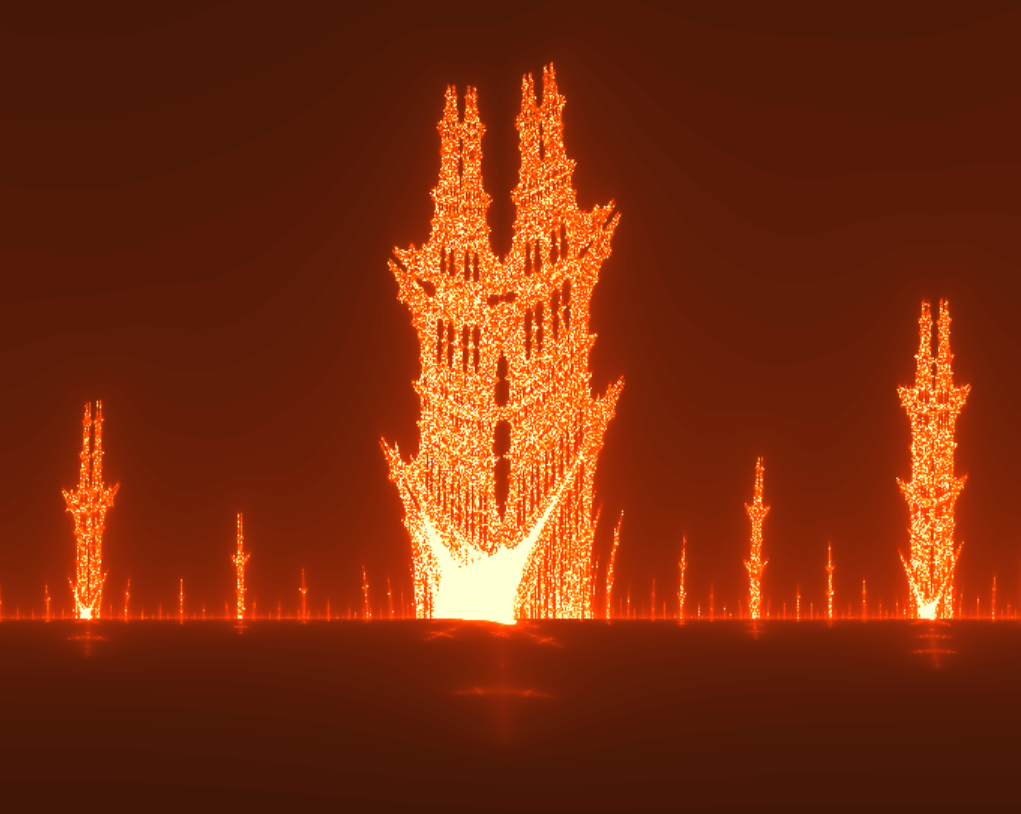
The burning ship fractal
As was explained above, the Mandelbrot set is generated by multiplying a (complex) number by itself, or stated more rigorously:
$z_{n+1} = z_n^2 + c, z_0 = 0$
where the index $n$ labels each consecutive iteration. The start value is zero.
The burning ship uses a somewhat modified version of this formula, namely:
$z_{n+1} = \left(|\text{Re}(z_n)| + i|\text{Im}(z_n)|\right)^2 + c, z_0 = 0$
In addition, a different (and fixed) color mapping is used that underscores the metaphor of a burning ship.
Mandelbrot set defined mathematically
A Mandelbrot set is defined as a two-dimensional set in the complex plane $\mathbb{C}$ for which an infinite sequence of numbers $z_n$, defined by the recursive relation
$z_{n+1} = z_n^2 + c, z_0 = 0$
does not diverge to infinity. The parameter $c$ is also known as point of interest.
The complex numbers that do remain bounded make up the inner glowing regions of the Mandelbrot set. Particularly interesting behaviour shows up near the edges of the set. The visualizations are realized by color-coding exactly this rate of divergence.
The Mandelbrot set illustrates the same principle as Conway's Game of Life, namely that complex structures can emerge from an astonishingly small and simple set of rules.
There are certain regions of values for the parameter $c$ (point of interest), where a tiny change in the value of this parameter $c$ results in a completely different (convergence) behaviour of our function. Any system that responds completely differently to any such a tiny change in its parameter(s) is said to behave chaotically.
Chaos theory studies exactly these kind of systems. They are said to behave chaotically, as they turn out to behave unpredictably given there sensitivity on their initial/boundary condition(s).
Chaotic systems are quite well known because of the so-called butterfly-effect: a distant butterfly flapping its wings a few weeks ago, may be causing a tornado’s route to change its course, similar to a slight change in a parameter value (in this case of the constant $c$) that causes the function to either diverge to infinity or remain bounded.
The butterfly-effect is more rigorously is defined as a deterministic non-linear response of a system that for its future state(s) is (extremely) sensitive on one or more of its initial conditions.
Some history
Robert W. Brooks & Peter Matelski first described and illustrated this set in 1978 as a part of a study on Kleinian groups. Two years later, Benoît Mandelbrot managed to create the first now well-known visualizations of the set, while working at IBM’s Thomas J. Watson Research Center in New York:
Because of his access to IBM’s computers, Mandelbrot was one of the first to use computer graphics to create and display fractal geometric images, leading to his discovery of the Mandelbrot set in 1980. He showed how visual complexity can be created from simple rules. He said that things typically considered to be “rough”, a “mess”, or “chaotic”, such as clouds or shorelines, actually had a “degree of order”. — Wikipedia
References
- What’s so special about the Mandelbrot Set? — Numberphile
- The Feigenbaum Constant (4.669) — Numberphile
Share on: